What might climate change look like in my area?
Climate change, wider environmental issues, and our action to address the harm humans are causing are major global issues, however the impacts are felt by people locally. Below are links to sources of information on what climate change and wider environmental issues look like, or might look like, across the UK. I am committed to working in the open, sharing useful information I come across with charities and funders. This page is a (self funded) live resource rather than a finished product. Only free to access resources are listed. Please get in touch if you identify any broken links or know of something that should be added.
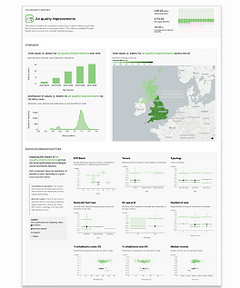
UK Co-Benefits Atlas
The UK Co-Benefits Atlas is a mine of information. Explore by local authority, by nation, by co-benefit, socio-economic factors or the interactive map. The CO-BENS project models 11 additional benefits based on actions recommended by the Climate Change Committee (CCC) in its Seventh Carbon Budget (2025) across 45,000 communities and regions within the UK. The site allows you to explore how, when and for whom benefits emerge to further understand connections between a wide range of social, economic and environmental priorities, and seeks to drive more effective decision-making.
Data included:
-
Air quality
-
Noise
-
Cold
-
Heat
-
Damp
-
Transport
-
Physical activity
-
Dietary improvements

Local Climate Adaptation Tool
The Local Climate Adaptation Tool is designed to explore scientific research on how local climates may change, the impacts on health and communities, who is most at risk and why, and which adaptations could help. It is searchable by local authority.
Data included:
-
Local climate change prediction
-
Climate hazard risks
-
Climate impacts
-
Community impacts
-
Personal & social vulnerabilities
-
Adaptations
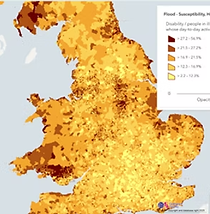
The ClimateJust Map Tool
The ClimateJust Map Tool covers floods and heat, from a climate justice perspective. For example, flood data can be viewed by neighbourhood vulnerability index, susceptibility due to age or health, inability to prepare due to prepare, respond, or recover due to issues including income level or access to support. The data sets do not always cover all four nations, however you can drill down by local authority area.
Data included:
-
Floods
-
Heat
-
Vulnerability

The National Trust Hazards Maps
The National Trust hazard map illustrates the threats climate change poses by comparing 2020 data with 2060 projections. The maps cover all four nations and issues including overheating, storm damage, and landslide risks. It is possible to search by postcode for results against hexagonal area blocks. More information can be found here and here. The primary audience is historical sites, however the information has wider applicability.
Data included:
-
Overheating
-
Humidity
-
Storm damage
-
Slope failure
-
Soil heave

Climate Central’s climate risk maps
Climate Central’s climate risk maps is a global interactive map, covering all four nations of the UK, that can be filtered by year, water level, temperature, warming choices and more. This includes projections of what different global warming scenarios (i.e. degrees above pre-industrial levels) could mean for different geographies.
Data included:
-
Sea level rises
-
Temperature
-
Warming scenarios
-
Ice sheets

Local emissions and plans
Carbon Copy's local emissions and plans tool enables searches to see action to reduce local carbon emission sand restore nature. It is searchable by local authority area, provides emissions breakdowns by sector, climate action plans, and a copy of the local climate warming stripes.
Data included:
-
Carbon emissions
-
Reduction targets
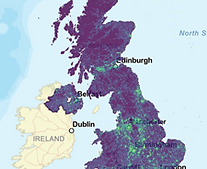
Guardian Air Pollution Map Tool
The Guardian worked with pollution experts to produce an interactive map revealing the worst-hit areas across Europe. The measurements refer to PM2.5 In the UK, three-quarters of people live in areas with exposure one to two times above WHO guidance, and almost a quarter face levels more than double the limit. Data is by local authority across all four nations. More information here.
Data included:
-
Air pollution

Health equals child air pollution map
The Health Equal's Is That Fair Campaign produced a map of the areas where children are worst hit by air pollution. 90% of us in Britain, including millions of children, are breathing toxic air that exceeds international health guidelines, meaning over 12 million children live in areas with toxic air.
Data included:
-
Air pollution

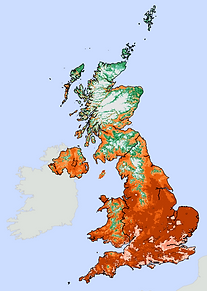
Is your postcode area vulnerable to extreme heat
BBC analysis estimates that six million people live in places at risk of higher heat during the summer months. Using satellite data from 4 Earth Intelligence, the BBC mapped how vulnerable postcode areas were to extreme heat in England, Wales and Scotland during periods of hot weather over the past three summers - shown with a heat hazard score. The data excludes Northern Ireland.
Data included:
-
Heat

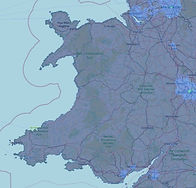
Friends of the Earth cooling effect of urban trees and parks
Friends of the Earth Maps of London, Manchester, Birmingham, Bristol and Newcastle upon Tyne, showing the cooling offset of trees and green spaces. Whilst only covering selected cities, they are both illustrative and fascinating.
Data included:
-
Cooling
-
Trees
-
Green spaces

mySociety and Climate Emergency UK Council Score Cards
The Council Climate Action Score Cards by mySociety and Climate Emergency UK, provide summaries of local authority action on climate change adaptation. Data is available for all four nations and can be searched by council type. Advanced filers allow for filtering by urbanisation, index of multiple deprivation, region and more. You can compare to the average scores of similar types of council. A useful related blog can be found here.
Data included:
-
Buildings & heating
-
Transport
-
Planning & land use
-
Governance & finance
-
Biodiversity
-
Collaboration & engagement
-
Waste reduction & food

Climate Coalition Local Intelligence Hub
The Climate Coalition and its 200 member organisations (including Friends of the Earth, WWF, and The Wildlife Trusts) use the Local Intelligence Hub to plan data-driven community engagement strategies, and feed informed conversations between constituents and their MPs. All four nations are covered, although the geographical range of different data sets varies.
Data included:
-
MP views on climate, nature & biodiversity issues
-
Public opinions on climate, nature and biodiversity issues
-
Place-based data on a wide range of issues
-
Movement data from member organisations
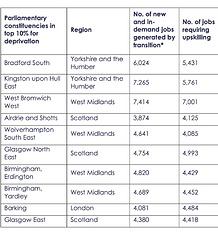
Place-based climate action network (PCAN) Just Transition Jobs Tracker
PCAN’s Just Transition Jobs Tracker provides data for jobs based in a large number of UK geographies (including local authority, parliamentary constituency, local enterprise partnership and combined authority areas). Across the UK, PCAN’s research has found that one in five workers, and 6.3 million jobs in total, will be affected by the transition to a net-zero carbon economy, with around 3 million workers requiring upskilling and around 3 million in high demand. More information here.
Data included:
-
Jobs transition
-
Upskilling required

Carbon & Place
The Carbon & Place site provides tools to allow communities, planners, and policymakers in the UK to understand their local carbon footprint. The tools are under development and include a place-based carbon calculator, retrofit explorer, land ownership explorer, land use and planning explorer, and a transport and accessibility explorer. Data is available by Local Authority and only for England.
Data included:
-
Carbon emissions by place
-
Retrofit
-
Land ownership
-
Land use & planning
-
Transport & accessibility

Climate Resilience Programme Climate Risk Indicator Explorer
The Climate Resilience Programme’s Climate Risk Indicators, developed by Reading University, provides local authority level and devolved nation level data on a range of climate indicators relating to temperature and rainfall.
Data included:
-
Temperature
-
Rainfall

Government flood risk data
Government data is available for long term flood risks in England, Wales, Scotland and Northern Ireland. Searchable by postcode.
Data included:
-
Floods
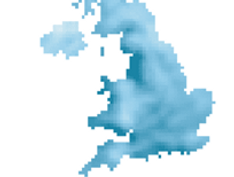
BBC and Met Office’s ‘What will Climate Change look like near me?’
BBC and Met Office’s ‘What will Climate Change look like near me?’ is searchable by postcode. All four nations are covered. Summary data is excellent and easy to understand. Further Met Office climate maps and data are available here. It uses the much more technical UK Climate Projections (UKCP) data available here.
Data included:
-
Temperature
-
Rainfall

Variations in climate opinions across the UK
The Yale Climate Opinion Maps for the United Kingdom shows public climate change beliefs, risk perceptions, policy support, experiences, and attribution beliefs across the UK. Data is available by country/region and local authority
Data included:
-
Climate beliefs
-
Climate risk perception
-
Climate policy support
-
Local experiences of storms, air pollution, floods, water pollution, extreme heat, sea level rises, agriculture, water shortages, droughts, wildfires

London Climate Risk Maps
City Hall’s London Climate Risk Maps are a treasure trove of information that should be available nationwide. Flood, heat and overall climate change risk data can be compared to a wide range of filters including deprivation, tree cover, air pollution, housing, ethnicity and more. Data is available by borough.
Data included:
-
Overall climate risk
-
Heat risk
-
Flood risk

UN opportunities map
This global opportunities map shows hazard exposure and the ecosystems that help reduce their impacts. It highlights the role of nature in lowering disaster risks, identifies areas where ecosystems should be protected, and prioritises places for restoration. Ecosystems are part of the solution to reducing risks. Data is global and so it not very precise in the map, but it provides a useful indication.
Data included:
-
Nature based solutions to flooding
-
Nature based solutions to landslides
-
Forest distribution
-
Landslide exposure & frequency
-
River flood exposure & frequency
-
Tree coverage change
-
Seagrass distribution & restoration opportunities
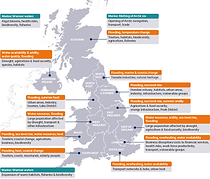
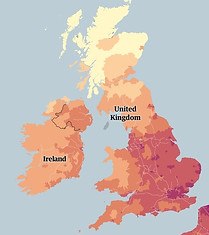
UKCIP Climate Change Map
The UKCIP (based in the Environmental Change Institute at the University of Oxford) map shows the most significant climate impacts as identified by the government’s Climate Change Risk Assessment (CCRA). It is a static map.
Data included:
-
Most significant climate impacts per UK region / nation
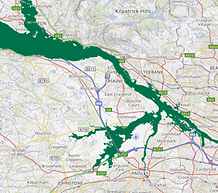
Scottish Environment Protection (SEPA) flood maps
The SEPA flood maps give detailed protections for Scottish flood risks searchable by postcode or town/city.
Data included:
-
Flood risk

How energy efficiency upgrades might change your bills
For England and Wales, the FT’s postcode searchable energy efficiency database shows how average energy bills for a specific type of property in a chosen area might change with energy efficiency upgrades. These can be compared to a national average.
Data included:
-
Energy
-
Cost of living

National Community Energy Map
The National Community Energy Map contains data on sites of community energy activity, primarily renewable energy generation but also some energy advice and energy efficiency services. Data can be viewed by project, MP constituency, region, local authority, distribution network (DNO), and community energy fund awarded projects.
Data included:
-
Community energy

UK Government: households off the gas-grid and prices for alternative fuels
UK Government’s report on households off the gas-grid and prices for alternative fuels identifies areas on and off the gas-grid in England and Wales.
Data included:
-
Energy
-
Cost of living
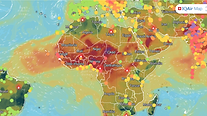
IQAir Air Quality monitoring
IQAir’s air quality monitoring is global, including the four nations of the UK, and provides real-time air quality monitoring.
Data included:
-
Air quality
National Atmospheric Emissions Inventory
The NAEI maps are an interactive application to explore 2020 emissions data across the UK. Searches are possible by pollutant and sector, and can be mapped against local authorities and devolved administrations.
Data included:
-
Air pollution
Air Quality in Wales
Air quality monitoring data from Wales was combined with UK data from the National Atmospheric Emissions Inventory (NAEI) to create detailed 1 km maps showing average and peak pollution levels across the country.
Data included:
-
Air pollution

Green Space Index
The Green Space Index is designed to track and analyse green space provision across Great Britain. More information here. Data is available by region, place or postcode, including for future green space projections, percentage of the population within a ten minute walk of a green space, green space provision per person and more.
Data included:
-
Green space access

Tree Equity Score UK
Tree Equity Score sets a national standard in each UK country to help make the case for investment in areas with greatest need. In addition to a tree equity score the site provides a wealth of useful information on wider local (in)equity.
Data included:
-
Tree cover
-
Income ranking
-
Air pollution
-
Heat disparity
-
Health ranking
-
Employment ranking
-
% of children & older people

Trees Outside Woodland Map
The Trees Outside Woodland (TOW) map shows trees above 3 metres and 5 m2 area outside of woodland, including small woods, groups of trees and lone trees. Approximately 30% of tree cover in England exists outside of the National Forest Inventory (NFI) woodland map (Forestry Commission, 2017). The NFI contains only woodlands > 0.5 ha. Data is for England only. You can search by town and postcode.
Data included:
-
Tree coverage

Biodiversity Net Gain (BNG) sites
The Wildlife Trust's BNG map is a public tool showing all off-site locations listed on DEFRA’s Biodiversity Gain Sites Register, updated daily with the latest information. Each site is displayed using grid reference data and includes details such as its reference number, baseline habitat, planned habitat, allocated habitat, and habitat condition. National summaries are also available, providing an overview of the types and scale of habitats being created through off-site Biodiversity Net Gain. It's searchable by postcode, local authority area, and place. More information here.
Data included:
-
Biodiversity

Natural England Peat Map
England’s peatlands and peaty soils have been detailed in the Natural England Peat Map for the first time using satellite imagery, artificial intelligence and in-depth data analysis. The data revealed that 80% of these climate mitigation critical habitats (carbon sinks) are dry and degraded. More information here and here.
Data included:
-
Peatland
-
Natural carbon sinks

Subsistence Map from Nanyang Technological University (NTU)
As part of a global study on subsidence, at-risk areas in London are mapped. Most have sunk by less than 1cm per year between 2014 and 2020, but some locations saw far greater movement, for example, South Upminster sank by an average of 4cm per year. Experts say root causes are groundwater pumping, heavy infrastructure loading and clay-rich soil, that when combined with climate change increases the risk of severe, prolonged flooding. Other parts of the UK will be affected as well.
Data included:
-
Subsidence
Climate-pest risk tool
Pests, diseases, and invasive species pose serious threats to farming, affecting both livelihoods and businesses. Major outbreaks can also undermine food security. Climate change is making these risks worse, as warmer, wetter winters create better conditions for pests and pathogens. The Met Office climate-pest risk web tool enables estimates of when microclimate conditions might be suitable for known, invasive plant pests. More information here.
Data included:
-
Invasive plant risk
Climate Shift Index
The Climate Central 𝗖𝗹𝗶𝗺𝗮𝘁𝗲 𝗦𝗵𝗶𝗳𝘁 𝗜𝗻𝗱𝗲𝘅 (CSI) quantifies how much more likely a day’s temperature is due to human-caused climate change. It is updated daily. Results are +/- 5x more or less likely because of climate change. More information here.
Data included:
-
Heat

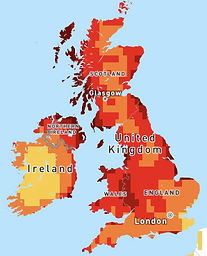
Vulnerability to climate related hazards in the UK
This report, commissioned from Sayers and Partners by the Climate Change Committee, details climate hazard vulnerability by local authority. The overall report provides insight, and the data set is available here. You will need to look up the local authority code to identify your area.
Data included:
-
Sensitivity to climate hazards
-
Adaptive capacity to cope with climate hazards
-
Exposure to climate hazards

The impact of climate change on population groups in Scotland
This Sayers and Partners report shares 2022 insights into how climate-related hazards and their impact on people and communities vary across Scotland. The project explored which, if any, population groups are disproportionately affected by flooding, high temperature and poor air quality, how they are affected now and potential impact in the future.
Data included:
-
Air quality
-
Heat
-
Rainfall
-
Social vulnerability
-
Systemic disadvantage
-
Climate hazards

English communities under threat from coastal erosion by 2100
This interactive map and accompanying analysis from One Home identifies 21 English coastal communities most at risk of coastal erosion, which is accelerating because of the climate crisis. These include seaside villages in Cornwall, Cumbria, Dorset, East Yorkshire, Essex, Kent, the Isle of Wight, Northumberland, Norfolk and Sussex, amounting to 2,218 properties that are together worth around £584 million.
Data included:
-
Coastal errosion

English coastal resilience
The Coastal Resilience Model (CRM) is a tool that measures how well areas can cope with coastal erosion and flooding. It looks at economic, environmental, and social factors, using free geospatial data. The tool combines many different measures into a single Resilience Index, using a method called Multiple-Criteria Analysis (MCA), which also takes into account priorities set by stakeholders. Data is searchable by local authority and for England only.
Data included:
-
Coastal resilience
AMOC collapse scenarios
The Atlantic Meridional Overturning Circulation (AMOC) is a system of ocean currents, including the Gulf Stream, that transports heat from the tropics northward in the Atlantic Ocean. This system is responsible for the UK's mild climate compared to other parts of the world at similar latitudes. Whilst uncertain on whether, and if so when, if the AMOC collapses, the UK could face an "ice age" type of winter with temperatures plummeting to near or below 0°C, or even colder, such as -18°C to -30°C in extreme events. While average temperatures might decrease, summers could still be hot due to existing global warming, leading to extreme cold-hot contrasts. Winter storms would become more severe, rainfall would decrease significantly, and sea levels would rise.
Data included:
-
Heat
-
Cold

Nature pollution hotspots
The Friends of the Earth nature pollutions hotspots research considered whether water, air, noise and light pollution reached damaging levels that threaten the survival of various British species. Pollution hotspots are areas that breach all four thresholds. Data is only available for England's local authority areas.
Data included:
-
Nature
-
Pollution

Access Data Exchange
The ACCESS Data Exchange provides a search tool, quick start guides and further information about a selection of UK environmental and climate related datasets which have been produced by a range of different organisations. This includes datasets from official government statistics to climate-focused opinion surveys.
Data included:
-
Links to other data sources
Copyright
This resource list is shared under Creative Commons License CC BY- SA. This license enables re-users to distribute, remix, adapt, and build upon the material in any medium or format, so long as attribution is given to the creator. The license allows for commercial use. If you remix, adapt, or build upon the material, you must license the modified material under identical terms. CC BY-SA includes the following elements:
-
BY: credit must be given to the creator.
-
SA: Adaptations must be shared under the same terms.
Resources linked above DO NOT fall under this license and the user should be careful to adhere to individual copyright requirements.